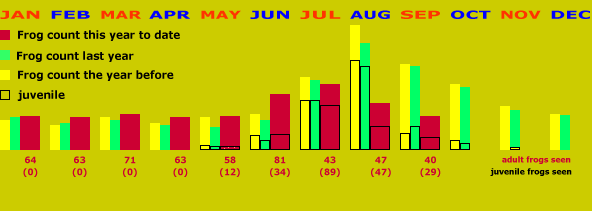
|
"Every
month now for the past three years," Marjorie says, "I have
waded around the perimeter of Slow Water Park at noon, and counted the
Rana viridiana frogs I see. The chart summarizes what I've seen.
"If
you look at the yellow and green bars, you can see how their life is pretty
much supposed to be: a certain number of frogs survive the winter, lay
eggs in early spring. Tadpoles hatch and start turning into young frogs
in May. There are plenty of insects to feed on, so the frog population
explodes. Then the juveniles grow up into adult frogs, and as food begins
to get scarce the population drops.
"The thick dark red bars show the number of frogs, both adult and
juvenile, that I've seen this year. Compare them with the green bars -
which show how the frogs were doing last year - and with the yellow bars
- which show how they were doing the year before that - and you'll see
that something's going wrong this year."
Back
|
|
JANUARY
"It seems like every winter, I see approximately the same number
of frogs. Food is scarce then."
MARCH
"I sometimes see a small jump in the number of frogs in March.
I think maybe a few come out of hibernation, or come back to the Park
from outlying areas."
MAY
"See the little boxes outline in black? Those show how many of
the frogs I saw were juvenile (young) ones. Juvenile frogs usually start
appearing in May."
|
|
JULY
"By July, there are PLENTY of insects, and the tadpoles are really
growing up fast. I see way more juvenile frogs than adults in July and
August."
SEPTEMBER
"You can see that usually juveniles are growing up into adults
at this time. But look at my most recent count for this year, in September.
Only about half of this year's juvenile frogs became adults, I would
guess."
OCT-NOV-DEC
(There are no red bars for these months because they haven't happened
yet. The story is set in early October.)
|